Only statesmen who can do their political and strategic thinking in terms of a round earth and a three-dimensional warfare can save their countries from being outmaneuvered on distant flanks.
–Nicholas Spykman1
Leaders who fail to think in space do so at their own peril. Nicholas Spykman published the above warning on the importance of mental maps in the context of World War II and the global challenges it presented, but his argument regarding the importance of spatial thinking to the nation’s security has never been more relevant. Thinking in space has long been an essential tool for thinking critically and communicating clearly when it comes to national security decision-making. The importance of mental maps and geographic communication are only growing in an era of new global challenges and renewed great power competition. Strategists and diplomats would benefit from gaining greater insight into the ways geographic information shapes national security decision-making. Moreover, understanding this impact can help produce recommendations for how American strategists can more effectively think in space.
The tools and resources needed to elevate the spatial thinking of those charged with conducting America’s foreign policy and securing the national interest are all available. Unfortunately, American strategists are currently not making full use of geographic information, inhibiting the policymaking process as well as the government’s ability to communicate global policy. Despite national security decision-makers having unprecedented access to geographic information and tools with which to visualize the world, this is not the golden age of spatial thinking in national security policymaking. The challenges confronting the national security community require learning new ways of spatial thinking — and relearning old ones — on a global scale.
The ability to “think in space” is more than mere navigation, map reading, or geographic literacy. The basic assumptions laid out in Richard Neustadt and Ernest May’s classic study Thinking in Time, which explores how decision-makers can make better use of history, are germane to this type of thinking.2 The first assumption is that busy decision-makers and their advisers are presented with a tremendous quantity and diversity of information every day. Thus, when it comes to thinking in space, such individuals can consume only a small amount of the geographic information available to them. Second, the pressures of time and limited information do not lend themselves to thinking critically or, in the case of thinking in space, questioning the geographic renderings they are presented with. Third, it is nevertheless possible to achieve marginal improvements — in this case, in the use of geographic information — and be, as Neustadt and May put it, “more reflective and systematic.”3
This article seeks to advance the conversation about how geographic information shapes national security decisions. While many have agreed with Spykman that “geography matters” and although there is a substantial literature on cartography as a form of communication, there has been little analysis of how geography “matters” when it comes to contemporary national security decision-making.4 This article begins by considering the position of national security decision-making at the intersection of the art and science of cartography and visualization, the unique cartographic consciousness of American strategists, and the various theories of geopolitics. These three elements are analogous to the three “images” Kenneth Waltz identified to discuss international relations: the individual, the national, and the global.5 In the sections that follow, I discuss the interaction of technology and geography, arguing that the ability of decision-makers to think critically in space has not kept pace with the advances of technology. The article then turns to the structure and process for employing geography in U.S. national security institutions and the importance of thinking in space in order to tackle 21st-century national security challenges. Finally, the article closes with recommendations for making the national security workforce more effective and identifies areas for further research.
Three Levels of Thinking in Space
Echoing Waltz, thinking in space occurs at three levels of national security decision-making: the individual, the governmental or national, and the global. Examining each of these three levels in sequence allows a careful review of the existing research, historical context, and theoretical foundations of different aspects of thinking in space. These three perspectives also provide useful analogies and suggest frameworks for evaluating contemporary issues. At the most basic level, thinking in space is the act of an individual seeking to make sense of space when it is out of sight and perhaps beyond his or her direct experience. On the national level, American society, including its vast national security bureaucracy, has developed its own uniquely American national geographic consciousness, with implications for how Americans use geographic information. At the highest level, geographic conceptualization of the international system — that is, geopolitics — bounds and focuses diplomacy and national security decisions.
The Individual Level: Capturing and Interpreting Space on a Flat Surface
Individuals must interpret and describe their geographic context, whether exploring a new city as a tourist or formulating wartime strategy. It is, therefore, essential to understand fundamental issues of cognition and spatial reasoning, which have been an important part of human evolution and can vary widely among individuals and even cultures.6 Some may possess Clausewitz’s inner eye — the military thinker wrote that spatial cognition is a commander’s “special gift.” His version of thinking in space was a “sense of locality” through which abstract space was “vividly present to the mind, imprinted like a picture, like a map, upon the brain, without fading or blurring in detail.”7 Others, however, might be what the Japanese call “hōkō onchi,” someone who is “directionally tone-deaf.”8 One famous study found unique patterns of activity and even structural changes in the hippocampus of the brains of London taxi drivers who mastered the encyclopedic knowledge required to pass the citywide driver licensing exam.9
Cartography is the way in which geographic information is communicated to and interpreted by the individual. The maps we study shape our spatial understanding, and the maps we make reflect deliberate choices to describe and simplify a complex reality. Lewis Carroll and Jorge Luis Borges both explored the idea of a fictional “perfect” map, on a one-to-one scale, which would be difficult to consult as “it would cover the whole country, and shut out the sunlight.”10 A perfect map is impossible, and thus every map is a simplified, two-dimensional abstraction of three-dimensional space. According to one provocative argument, “not only is it easy to lie with maps, it’s essential.”11 These lies could be accidental misrepresentations or deliberate deceptions, but the best maps make intentional and transparent choices, trading some distortions for others, such as scale, projection, and symbolization. Thus, the mapmaker only tells “white lies” and the informed map reader knows which lies the map contains and why.
Scale and projection are both practical cartographic “lies.” A wall-sized world map cannot contain the same detail as a state highway map, but both have their purpose. Projection allows the transfer of three dimensions to two but entails some distortions in the process: No projection can preserve true distance, area, and shape in the same map. For example, many map users are familiar with the Mercator projection’s heavy distortion of distance and area. While the unlikely hold of the Mercator projection on American education is an instructive history of addiction to lazy conventions, there is nothing technically inaccurate about the projection itself, which was a remarkable technological achievement that facilitated global trade and exploration.12 The essential point is that mapmakers must select an appropriate projection and scale to facilitate accurate interpretation by the map user, and informed map users must understand the reasons for those choices.
Image 1: Comparison of Six Different Common Projections, All Centered on Beijing (Maps by author, 2019)
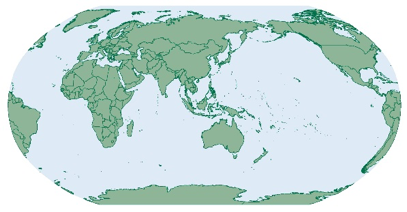
Robinson: Compromise to reduce distortion of shape, area, and distance.

Goode Homosoline: Distortion reduced by interrupting the map in areas less important to the user.

Miller Cylindrical: Compromise that fits on a rectangular page, but distorts distance and area, particularly in high latitudes.

Orthographic: Realistic “globe” view, but shapes and area are distorted. Can only depict one hemisphere.
Miller Cylindrical: Compromise that fits on a rectangular page, but distorts distance and area, particularly in high latitudes.
Gnomonic: Every line is a great circle, showing direct paths between points, but area and shape are distorted. Can only depict one hemisphere.
Mercator: Useful for ocean navigation, but significant distortion of distance and area. The example above includes polar regions which are typically cropped.
There is no perfect answer when it comes to choosing a map projection, though there are many wrong ones. One map familiar to many in the U.S. military is “The World with Commanders’ Areas of Responsibility,” which uses the Miller Cylindrical projection to delineate the regional combatant commands under the Unified Command Plan. The standard world wall map produced for the Department of Defense also uses the Miller projection, which has the advantage of being rectangular and fitting neatly onto a sheet or wall, but is only slightly less distorted than the Mercator projection in terms of high latitudes.13 The Miller projection is inappropriate, for example, for a planner in the Pacific seeking to understand or convey the tyranny of distance in that theater. When distance is the central issue to a planning team, an equidistant projection, of which there are many kinds, is most appropriate. However, American officials rarely use equidistant projections, possibly because they look unfamiliar and distort shape while preserving distance. When comparing the size of two areas or mapping the distribution of data, such as population density, an equal-area projection is most appropriate and accurate. When mapping the entire world onto a single sheet or wall, a “compromise” projection provides a balance that accepts, but minimizes, distortions to the distance, area, and shape.14 The creator of one of the best compromise projections, Arthur H. Robinson, called for map creators to heed principles of graphic design just as an author “must employ words with due regard for many important structural elements of the written language, such as grammar, syntax, and spelling.”15
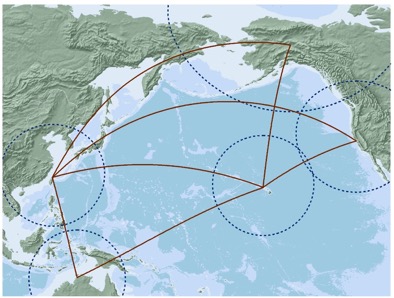

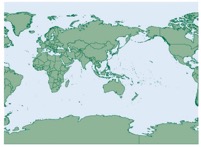
Image 2: The Miller Cylindrical projection (top) is common to many Department of Defense wall maps. The Two-Point Equidistant projection (bottom), shows true distances to Honolulu and Taipei. Both maps are at the scale of 1:65,000,000, and show the Great Circle paths among Taipei, Honolulu, Fairbanks, Darwin, and San Francisco. The dashed rings show 2000-kilometer ranges around these cities. Maps by author, 2019.
Symbolization is another area in which cartographers must tell necessary “lies.” To make a road, river, or small island visible on a map, the cartographer often must make it far wider or larger than it actually is at that scale. Abstract symbolization provides a powerful language through which cartographers can communicate, but can also easily become a source of inadvertent blunders or deliberate deception. The design choices that cartographers make significantly impact the ways in which individuals will perceive geographic information. Even if scale and projection are appropriately and effectively used, the employment of line, color, information density, text labels, and symbols bear on accuracy and ease of interpretation. Because maps can feature centrally in national security decision-making, this is particularly important to bear in mind.
The National Level: Development of American Cartographic Consciousness
Zooming out from the individual to the national level, one can see how a unique American cartographic consciousness has evolved with the nation, shaping the way that Americans — including national security decision-makers — view the world. Every nation, and its government, has its own relationship with maps. The national map is a critical dimension of national identity and governments have a vested interest in the regular, public declaration of the extent of their sovereignty. Kosovo and Cyprus, for example, put the outline of their borders on their national flags.
America’s cartographic consciousness developed over several principal phases. Spatial thinking may have had an early hold on the national psyche in a nation founded by traders and explorers — George Washington himself had an early career as a surveyor before his military and political life. The colonial era was marked by exploration, colonization, and conquest of the interior, after which national independence marked an inflection point as the young republic sought to craft its own geographic identity.16 Before and after independence, there was a grand spatial dimension to America’s commitment to territorial expansion. This was evident in the colonial era but grew rapidly in the years after independence, most notably with the Louisiana Purchase and the Jefferson administration’s sponsorship of the Lewis and Clark expedition. Susan Schulten, a leading scholar of the role of cartography in American society, highlights important links between geographic education and the development of the early republic. Emma Hart Willard, a prominent educator of the period, explicitly connected the teaching of geography with national development and promotion of an American identity.17
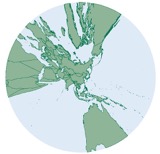
The Civil War represented a watershed moment in popular mapping, as newspapers published battle maps and Americans both north and south followed the progress of the war. Some of the first American maps to shade or color code the different states (i.e., choropleth maps) distinguished slave and free states, while the Lincoln administration closely studied maps detailing the distribution of slave populations in the South. The 1874 publication of the Statistical Atlas of the United States, charting data from the 1870 census, opened a new era of the American government using cartographic data in support of policymaking.18 This period also saw growing institutional commitment to the study and advancement of geography, as seen in the establishment of the American Geographical Society in 1851 and the National Geographic Society in 1888. It was also at this time, in 1878, that Harvard appointed its first geography professor.
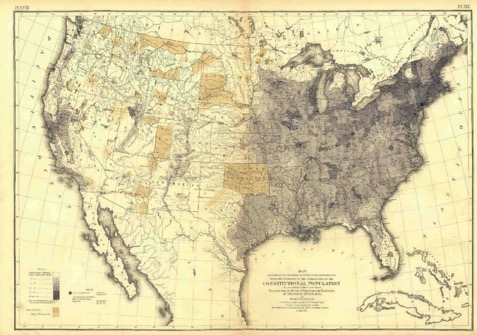
Image 3: Population density, as depicted in the Statistical Atlas of the United States for 1870. Courtesy of the U.S. Census Department
At the end of the 19th century, a truly outward and international perspective to America’s cartographic consciousness began to emerge. The Spanish-American War, the “Great White Fleet,” and Alfred Thayer Mahan’s writings on global sea power shifted America’s cartographic consciousness to a maritime and international focus. The acquisition of Hawaii, Guam, and the Philippines forced an expansion of the national map that included the vast scale of trans-Pacific distances. And although Mahan did not achieve the same popular acclaim in his own country that he enjoyed in Europe, he had a clear impact on key leaders like Theodore Roosevelt, who, as assistant secretary of the Navy and later as president, promoted the development of the United States into a global naval power.19
Franklin D. Roosevelt’s wartime leadership demonstrated the value of thinking in space: He had an innate spatial sense that strengthened his critical thinking and he employed maps in communicating with his administration. But in addition to creating a White House map room and attaching hand-annotated maps to memoranda, Roosevelt employed geography to explain national strategy to the public, most famously in his Feb. 23, 1942, radio address, for which newspapers nationwide printed accompanying world maps. Roosevelt directly contributed to a new national consciousness of strategic issues in World War II that Alan Henrikson called a “revolution…in the way Americans visually imagined the earth and represented it cartographically.”20
The career of cartographer Richard Edes Harrison exemplified this revolution.21 In the 1930s, Harrison began producing maps emphasizing nontraditional projections and perspectives — particularly orthographic projections, which provide a realistic “globe” view, but in which shapes and areas are distorted and only one hemisphere is viewable at a time. He sacrificed convention to enable visualizations that better reflect the reality that the world is three-dimensional than do most flat, two-dimensional maps.22 Harrison’s 1944 Look at the World: The Fortune Atlas for World Strategy includes dozens of original maps of war zones from multiple perspectives and advances several arguments about how different nations’ unique spatial perceptions influenced the making of good or bad strategy. Harrison made an impassioned plea for the importance of “geographical sense” to Americans who had been forced by the war from “a period of cartographic lethargy.”23 He also attacked the “psychological shackles of conventional maps” that prevent Americans from effectively conceptualizing geographic challenges, and held particular disdain for the “invariable placing of North at the top [as] geographical cant in its most pernicious form.”24
The popular atlases and magazine maps of World War II created the defining spatial conception of global threats facing America — Henrikson called this new global awareness “air-age globalism” — that continued into the early years of the Cold War.25 The threat of nuclear attack by strategic bombers and intercontinental ballistic missiles brought new military challenges into sharper focus, such as the strategic value of the Arctic. Maps with azimuthal equidistant projections centered on the North Pole became essential to understanding the threat axis. Those emphasizing the cartographic perspective of air-age globalists reached their peak with Alexander de Seversky, whose maps depicted the Arctic as the “area of decision” situated most directly between the industrial heartlands of the United States and Soviet Union.26
“Harrison made an impassioned plea for the importance of “geographical sense” to Americans who had been forced by the war from “a period of cartographic lethargy.””
Although remarkable technical achievements in cartography continued throughout the Cold War, geography’s place in academia did not keep pace. Indeed, despite the demand for geography skills during World War II, Harvard eliminated its geography department in 1948. Neil Smith argues that Harvard’s decision marked a key moment in an “academic war over the field of geography,” in which the institutionally weak discipline faced challenges in establishing itself as a true science, something more than a set of technical skills and distinct from the other physical and social sciences.27 Personal and academic rivalries also played a role in the Harvard affair, as did McCarthyite accusations that university geography departments were a “haven for socialists.”28
Also in decline from a relative high point during World War II was the effectiveness of geographic discourse between national leaders and the public, which did not carry forward to Vietnam. Former Secretary of Defense Robert McNamara wrote late in life that Indochina had been effectively “terra incognita” for the Kennedy-Johnson national security team.29 But the United States employed ample cartographic resources in support of combat and economic development efforts in Vietnam. Furthermore, at various stages of America’s military involvement in Vietnam, President John F. Kennedy, McNamara, and President Richard Nixon all used maps in televised press conferences on the Vietnam War, but the effect was somehow less compelling than Roosevelt’s radio address. Johnson, for his part, studied a terrain model of Khe Sanh as he directed his advisers to avoid a repeat of Dien Bien Phu, perhaps reflecting the broader tendency to fixate on operational and tactical situations, rather than the strategic level of war in that conflict.30
Over the course of the Cold War, the associated cartographic imagery became more ideological than geostrategic, reflecting the global contest for influence between the two superpowers.31 The Cold War map simplistically reduced the world (on a Mercator projection) to color-coded countries aligned to either the United States or the Soviet Union. It is not yet clear how to describe the American cartographic consciousness in the post-Cold War or post-9/11 world. The low level of geographic literacy among Americans in an age of globalization is a popular and longstanding complaint.32 In one recent study, conducted at a time of high tension on the Korean peninsula, only 36 percent of American respondents could correctly identify North Korea on a map, while only 16 percent of Americans could correctly locate Ukraine in a similar 2014 study.33 But these results are nothing new: In December 1950, with the Korean peninsula in crisis, the New York Times front page highlighted the poor results of a survey on geographic education in American schools and colleges.34 Indeed, for all of the geopolitical turbulence of recent decades, America’s cartographic consciousness and the way that the American national security apparatus functions have been remarkably consistent since the end of the Cold War.
The International Level: The Theory and Context of Geopolitics
At the international level, geographic context and literacy are closely related to how decision-makers perceive the structure of the international system and the nature of the powers that define it. Saul Bernard Cohen defines modern geopolitics as the “scholarly analysis of the geographical factors underlying international relations and guiding political interactions.”35 Geopolitics shapes the way national leaders view the outside world and how they make national security decisions. Just as individuals may not comprehend the distortions of the map they are looking at and Americans may not reflect on the uniqueness of their own cartographic perspective, national leaders may not realize it when they invoke geopolitical theories or engage in some of the great debates of geopolitics. In other words, policymakers may not be interested in geopolitics, but geopolitics is interested in them.
The principal early proponent of geopolitical thought was Halford Mackinder, who elaborated the concept of a Eurasian “heartland,” control of which determined global power. Mackinder’s career overlapped with Mahan’s, but they advanced very different arguments about where the seat of global power rested. Mackinder, writing at a time when Mahan’s theories of sea power had reached peak popularity, argued that the true pivot of world power was on land, and that advances in the technologies of land power diminished the importance of maritime trade and naval power.36 However, Mahan the historian and Mackinder the geographer shared a common geographical model and common assumptions about the role of military power and conflict in determining a nation’s status in the international system.37 This enduring understanding of a world in which regional centers of power compete within a closed system has profoundly influenced how strategists conceive of global space.
Nicholas Spykman fused Mahan and Mackinder in his analysis of great power competition for regional and global influence.38 Spykman accepted much of Mackinder’s geographic conceptualization, but argued that the critical geostrategic region was not the Eurasian heartland but the coastal “Rimland” that surrounds Eurasia, an area that Mackinder referred to as the “inner or marginal crescent.”39 According to Spykman, a strong power like the United States should, therefore, support buffer states (i.e., in the Rimland) and fight its enemies abroad, as only weak states fight defensively at their own borders or within their own territory. Spykman also studied the difference between how land powers and sea powers think in space, writing in 1938 that “[a] land power thinks in terms of continuous surfaces surrounding a central point of control, while a sea power thinks in terms of points and connecting lines dominating an immense territory.”40 Spykman perceived that the unpopularity of foreign engagement created a natural cycle among great powers — especially the United States — of war, isolation, alliance, and renewed war. Furthermore, Spykman explicitly connected the structure of the international system to domestic and foreign policy, calling the tension between interventionism and isolationism “the oldest issue in American foreign policy.”41
“In other words, policymakers may not be interested in geopolitics, but geopolitics is interested in them.”
Spykman’s perspective helped shape policy throughout the Cold War, but the politics and structure of the immediate post-Cold War world initially appeared dramatically different than the preceding centuries of great power competition and traditional geopolitics. However, in his 2012 book, The Revenge of Geography, Robert Kaplan highlighted the enduring importance of geopolitics following the end of the Cold War. Not only does he begin his first chapter with an argument for “recover[ing] our sense of geography” that was lost with the end of the Cold War, but he devotes a full chapter to the 21st-century importance of Spykman’s Rimland thesis.42 More recently, Jakub Grygiel updated Spykman’s thinking for the new century. Grygiel’s 2017 book, The Unquiet Frontier, co-authored by Wess Mitchell, makes a geopolitical argument for resisting the lure of isolationism and sustaining American engagement abroad to counter Chinese and Russian probing for weak points in America’s international position.43
The context and theory of geopolitics are not merely academic. Contemporary strategists debate whether Mahan or Mackinder holds more sway in guiding China’s rise. The answers to that debate hold important implications for how America should compete with China over the long term.44 The thinking of individuals across the American foreign policy establishment, from realists to liberal internationalists, has been firmly rooted in Spykman’s concept of forward engagement for the better part of a century. Spykman also discussed the possibility that the Asian littorals might one day “be controlled not by British, American, or Japanese sea power but by Chinese air power.”45 He would doubtless be amazed at the geographic tools — from GPS to Google Earth — available to the average person and the geospatial support provided to American national security decision-makers, but at the same time dismayed at their inability to “do their thinking in terms of a round earth and three-dimensional warfare.”46
In order to critically analyze national security decision-making, it is essential have a greater awareness of how thinking in space takes place on the individual, national, and international levels. These national security decisions occur within a specific context on all three levels, often in ways decision-makers may not be fully conscious of. As Robert Jervis writes, “the roots of many important disputes about policies lie in differing perceptions. And in the frequent cases when the actors do not realize this, they will misunderstand their disagreement and engage in a debate that is unenlightening.”47 The preceding theoretical and historical foundation therefore serves as the basis for the following portion of this article, which focuses on the practical considerations of how well the national security establishment thinks in space and how it might improve.
The Use of Geography in National Security Institutions
There is little data on how exactly government institutions employ the vast amounts of geographic data and finished cartographic products created by the U.S. government. Public strategy documents, congressional testimony, and some declassified products offer the public a small but limited view of the frequency with which cartography is utilized in discussions on issues of defense and foreign policy and the quality of such cartography. The extent to which officials employ cartography and visualization to explain a decision is relevant, and potentially a meaningful proxy, to how much “thinking in space” went into that decision. Thinking in space is not just useful during the decision-making process itself. It is also central to effectively communicating how a given decision will be implemented. Using text and cartography together in public documents can help explain a national security issue to the public more effectively, as well as guide the execution of policy at the lower levels of government.48
It is notable that neither the 2017 National Security Strategy nor the 2018 National Defense Strategy includes any maps.49 Similarly, the National Defense Strategy Commission’s 2018 assessment of the National Defense Strategy, the 2018 Nuclear Posture Review, the Navy’s 2018 Design for Maintaining Maritime Superiority, and the 2017 Defense Posture Statement all lack maps, although they were laid out by professional graphic designers and include other visual aids, such as photographs and charts.50 Despite their purpose being to explain global strategy, these documents use maps with less frequency than a typical issue of the Economist. By contrast, the annual report to Congress titled, “Military and Security Developments Involving the People’s Republic of China,” mandated since 2000, includes 14 maps in its 2018 edition, including a diverse set of scales and projections.51 Although released by the Office of the Secretary of Defense, it is important to note this report is fundamentally an intelligence product and is largely compiled by the Defense Intelligence Agency. Similarly, the Defense Department’s 2019 Missile Defense Review includes a few small and informative maps but is also produced by the intelligence community.52 The lack of maps in the majority of these documents does not mean that cartography and spatial thinking played no role in their development and presentation or the implementation of the policies they prescribe. For example, those who developed the 2018 National Defense Strategy consulted maps while considering new operating concepts, testing these concepts in war games, and presenting National Defense Strategy themes to key stakeholders.53 However, these cartographic efforts were ad hoc and largely incidental to the process of developing and implementing the strategy.
Whether considering grand strategy, military capability, national cartographic consciousness, or individual spatial cognition, to exclude geographic content fails to make use of a valuable tool. Geographic expertise and resources are scattered widely and inconsistently across the national security enterprise, but many organizations have some sort of department that produces cartographic or geospatial products, often in conjunction with other graphic design services. That some parts of the government employ geography in their public messaging and others do not could reflect deliberate choices about the most appropriate or most effective ways to make an argument. More likely, however, is that the differences are the result of widely varying cartographic capabilities across the government, unevenly distributed geospatial resources, and long-unquestioned institutional processes.
“The government, with some exceptions, has generally treated geography and cartography as a service to be provided to customers, rather than as a core capability for decision-makers.”
The National Security Council, the Office of the Secretary of Defense, and the Joint Staff would all benefit from a much greater ability to produce original geographic content in house. These organizations are among the most influential in the interagency policymaking process — indeed the National Security Council is its central coordinator — and yet they lack their own cartography capabilities. Policymakers at the National Security Council, Office of the Secretary of Defense, and the Joint Staff may be avid consumers of maps, and they all certainly have access to quality geographic products through the intelligence community. However, that this capability has been almost exclusively allocated to the intelligence community has important implications. The intelligence community, by nature and by design, resides primarily in a classified domain, which allows it to take the sensitive information it collects and present it through geospatial visualizations. But working with classified systems can also hinder the employment of the full range of software and data that is available, as security policies can slow the adoption of commercial or open-source software suites and data repositories. In recent years, many successful geography applications have emerged from open-source software models that emphasize crowd-sourced development and collection of data by a wide array of volunteers — as in the case of OpenStreetMap — but government agencies prefer traditional models of software development and data collection from established corporations.54 A more subtle challenge arises from the relationship between the intelligence community and policymakers, in which intelligence seeks policy relevance but avoids making policy prescriptions. High standards of security and objective independence from crafting policy are vital principles within the intelligence community, but when it is the only one with cartographic resources, these firebreaks can also serve to keep the best maps and most compelling geographic communication out of the hands of decision-makers.
The government, with some exceptions, has generally treated geography and cartography as a service to be provided to customers, rather than as a core capability for decision-makers. That is, cartography is a support function assigned to technical specialists, rather than a skill, like effective writing, to be prized by policy advisers or senior officials. This has been particularly true in the military, which has considered mapmaking an enlisted function and not a skill set needed in the officer corps. The military has diminished even the enlisted focus on cartography through the elimination of certain specialties or their merger with other disciplines.55 Government organizations have also been hampered in geostrategic thinking by the shift from general and thematic cartography to specialized geospatial intelligence. A subtle difference is apparent in the different treatment of geography at the National Geospatial-Intelligence Agency and the CIA. The National Geospatial-Intelligence Agency’s doctrinal definition of geospatial intelligence is that it “consists of imagery, imagery intelligence, and geospatial information,” emphasizing imagery and data over cartography.56 By contrast, the CIA’s cartography center emphasizes cartography as a form of communication “to present the information visually in creative and effective ways for maximum understanding.”57 This focus on visual communication may be narrower, more traditional, and less technical, but it is probably more consistent with promoting thinking in space.
Visualizing and Communicating the Geography of Coming Challenges
The contemporary environment and the threats that loom on the horizon present new challenges, and a few opportunities, for thinking in space. The American national security enterprise has a chance to regain the skills it has lost. Now is a time when those charged with thinking in space in defense of the nation can gain a new and more sophisticated understanding of the geographic information they consume, the limits of their own expertise in using it, and ways to cope with ambiguity. Although lacking any maps, as noted above, the 2018 National Defense Strategy uses spatial language to argue for a reappraisal of the nation’s strategic position. The strategy document argues that “every domain is contested—air, land, sea, space, and cyberspace,” that battles are conducted “at increasing speed and reach,” and that “the homeland is no longer a sanctuary.”58 By naming the leading competitors or pacing threats, the language of the National Defense Strategy allows for more geographic clarity than similar previous documents that referred only generically to capabilities or regions. Stating explicitly that China, followed by Russia, should be the strategic focus of the U.S. military, puts a geographic frame on planning discussions.
Chinese military modernization has reintroduced old lessons about the tremendous expanse of the Pacific theater. Preparing for a high-end conflict that emphasizes the air and maritime domains might require relearning the cartography of the air-age globalism that took hold in the 1940s. Invoking the “tyranny of distance” has become a standard talking point for officials highlighting the difficulties of rapid response and the importance of forward deployment and foreign partnerships in the Pacific. But there is insufficient geographic content to support these points beyond rudimentary — and often inaccurate — range rings. If China is the primary concern for force planners, they must employ better mental and physical maps of the Pacific. Well-articulated spatial content, with geographic arguments supported by cartographic communication, would help strategists present a more effective case to their audience. The true implications of the tyranny of distance and the key geographic relationships of the Pacific theater need to be fully understood by strategists and clearly argued before the national leadership, the American people, and key U.S. allies.59
In particular, there are three domains that are crucial when it comes to constructing both mental and actual maps if decision-makers want to be prepared for coming challenges. Space, cyberspace, and the undersea environment are essential strategic domains whose physical infrastructure is difficult to visualize spatially. Very few humans have navigated a submarine or charted the motion of a spacecraft and while cyberspace has become a part of ordinary life, few can explain the physical infrastructure of the internet. Leading Chinese strategists have emphasized that these domains are critical, calling space and cyber the new “commanding heights” of military capability that could “determine the outcome of future wars.”60 Making smart investments to prepare for future conflict and compete with peer adversaries in these domains requires the commitment of a host of political, technological, and financial resources. These weighty national security decisions require critical analysis of complex data. Thinking in space must play a part in these decisions, even if spatial visualization proves difficult.
Space
Preparing for, deterring, and executing operations in the space domain requires decision-makers to think spatially. Outer space may be far from the earth’s surface where map coordinates are plotted, but it remains fundamentally spatial. Thus, we can analyze and visualize space in some of the same ways we approach traditional geographic problems. The coordinates that describe the three-dimensional position of a satellite are no different than those of an airplane, except that they change much more rapidly, the atmosphere is not a factor, and the distances are so great that communication delays are a more important factor, even at the speed of light.
“These weighty national security decisions require critical analysis of complex data. Thinking in space must play a part in these decisions, even if spatial visualization proves difficult.”
American policymakers seeking to accurately envision the spatial context of objects above the Kármán Line probably fare little better than American high school students trying to locate Iraq on a world map. Supporting decision-makers in analyzing this domain will require a mix of traditional and unconventional geospatial materials. There is not a widely available body of accessible reference material for visualizing earth orbits. The established standard, Systems Tool Kit (formerly known as Satellite Tool Kit), contains a powerful visualization engine, but, as with many geographic information systems suites, it is designed for experts, not generalists, in order to analyze complicated physics problems.61 Outside of science education posters, there are few wall charts or reference atlases of various satellite constellations. Such charts — unclassified base maps of space — do not yet adorn the walls of conference rooms in which policymakers discuss investing in this vital domain. In part, the nature of orbitology makes a static or “flat” reference product on paper problematic, thus, animation or interactive displays may foster more understanding. Although creating, transporting, and displaying a digital interactive product has major practical limitations, it would almost certainly be more accurate and effective than static products, in part because objects in space move very fast and static maps cannot accurately portray location in time.62
Cyberspace
Visualizing cyberspace in recent years has been an interesting artistic endeavor, but practical mapping of the domain in support of national security decision-making remains undeveloped. Gaining a better understanding of the overlap between physical and virtual domains has become vitally important for senior officials. There have been a variety of official and unofficial efforts to generate comprehensive, global maps of internet traffic and devices, and books like The Atlas of Cyberspace have compiled different conceptual visualizations.63 These efforts highlight that the private sector dominates both the visualization and the management of the physical infrastructure that supports internet traffic,64 while private companies play an increasingly central role in discovering and responding to cyber attacks. They also own and manage the majority of the key information for visualizing the internet, such as charts of cables and switches and raw data on the paths through which internet traffic is routed. 65 One author found the researchers from a leading visualization firm, TeleGeography, to be part of a “small global fraternity that knows the geography of the internet” and has robust mental maps of the geographic movement of traffic on the internet’s physical cables.66
Undersea
The undersea domain has captured less attention in the popular press than space and cyberspace, but it is nevertheless a vital strategic domain that challenges the geographic thinking of national security leaders. In contrast to the cyber and space domains, shortfalls in thinking about undersea space derive more from disinterest and lack of imagination than technical or bureaucratic challenges. Anti-submarine warfare was a high priority in World War II, but submarine operations of that era were only partially an undersea contest. Competing for mastery of the undersea domain reached its height in the Cold War ocean surveillance networks and reliance on submarine-launched ballistic missiles for strategic deterrence. Such issues of military use of the undersea domain have become prominent again, but technology has also dramatically increased the commercial importance of the undersea environment. The overwhelming majority of global communication rides on seabed fiber-optic cables and the growing feasibility of extracting seabed resources requires an enhanced understanding of the undersea geography that determines competing claims and the accessibility of those resources. These challenges raise the importance of making national security leaders familiar with the shape and science of the undersea world. Those who develop and implement national strategy will have to become more spatially conversant in presenting and considering the strategic issues of the undersea domain.
Challenges to Thinking in Space
Getting policymakers and military leaders to think in space more effectively is easier said than done. There are a number of challenges to enhancing geographic skills — some of these challenges are more cognitive and abstract, while others are more practical and procedural. But they must be described so that they can be understood and overcome. As discussed above, technology has made possible some remarkable uses of geography in the digital age, but technology is a double-edged sword that creates tradeoffs for the decision-maker relying on a digital reference or navigational aid. Similarly, there are tradeoffs in the specific ways that national security organizations use geographic information, with implications for the quality and efficiency of the decisions these groups make. Confronting the nature of these tradeoffs suggests national security decision-makers would benefit from adapting their tools and processes to improve their ability to think in space.
The Effects of Technology on Thinking in Space in the 21st Century
The idea that technology impacts the spatial thinking of its users is not a new one. In 1913, Gerard Stanley Lee wrote that “the telephone changes the structure of the brain. Men live in wider distances, and think in larger figures, and become eligible to nobler and wider motives.”67 A growing body of research has examined the effects of technology on spatial thinking as digital systems replace analog techniques in cartography and navigation and indicates that technology can both aid and hinder thinking in space. Geographic information systems technology encompasses the collection, manipulation, analysis, and display of increasingly rich data sets, empowered by global navigation systems, the storage of big data collected in the field, space-based imaging sensors, and the computing power to process it all. This technology has become an essential tool for an ever-broadening set of organizations, from businesses seeking more efficient supply chains to local governments managing public services and utilities and nongovernmental organizations conducting disaster relief. The essential skills for developing geographic tools and manipulating geographic information, i.e., geographic information systems technology, has become much more an exercise in computer programming and development of user interfaces than of traditional cartography. Scientists studying the interface between human cognition and digital maps discuss “navigational efficiency,” suggesting the ideal geospatial tool would reach maximum efficiency by requiring no geographic knowledge or critical thinking.68
“For all of the advances of integrated sensors and communications in modern military systems, some contemporary military officers have noted issues with spatial cognitive de-skilling within the officer corps due to using these digital tools in place of analog processes and paper charts. ”
Digital navigation is the ubiquitous and essential means by which many people around the world engage with the mapped environment. But the ease of use and narrow purpose of navigational tools and digital map applications have also led to what researchers identify as “spatial cognitive deskilling” — people who use certain tools and interfaces actually acquire less spatial knowledge than they otherwise would.69 A visual display that demands less skill of the user and strips away context can have clear benefits. Henry Grabar notes this is perhaps most evident in the way that a transit diagram, technically a “cartogram” rather than a map, allows a tourist to navigate the New York subway or London Underground. However, Grabar also points out that such navigational tools abandon geographic accuracy and provide little to no context of the surrounding environment. Having “small screens and egocentric perspectives, mobile navigation systems function like blinders, reducing the landscape to the width of a street. They narrow the world.”70 Indeed, a broader view of the world provides a reminder of the tendency for technology to narrow the perspective by abandoning the context. A remarkable 2018 New York Times map of every structure in the United States, produced in both paper and online interactive forms, prompted Harvard’s Susan Crawford to remark on how modern technology denies individuals important spatial context, saying that “we lose what’s fascinating about a place by not having this bigger picture.”71
Small navigational displays in cars replicate a capability that has been available in military cockpits for decades. Various studies have examined how to optimize displays for tactical situational awareness.72 Recent studies of U.S. Navy doctrine have praised the development, circa 1943, of the shipboard Combat Information Center, which allows operational commanders to think spatially with new sensors (radar), new displays (the Plan Position Indicator scope), and networked communications (radio).73 For all of the advances of integrated sensors and communications in modern military systems, some contemporary military officers have noted issues with spatial cognitive de-skilling within the officer corps due to using these digital tools in place of analog processes and paper charts. Moreover, digital screens limit the size and resolution of the map display and the hardware and software that integrate sensors, processors, databases, and displays require significant maintenance. The Navy now relies on digital charts that can be updated more readily than paper charts, but the system needs constant information technology support for the maintenance and integration of various electronic components. Developing skilled navigators necessitates specialized training with analog and digital systems alike.
Digital systems require their users to be especially conscious of the quality and sources of the data displayed.74 One study of flight skills among pilots found that certain basic skills were declining due to reliance on advanced instruments and that pilots consistently overestimated their level of skill in the event of losing advanced systems.75 One critique of the Army’s digital systems, under the Command Post of the Future, is that these new tools are not expedient for field use since they have maintenance requirements that are too steep for deployment in austere environments. Moreover, they can introduce as much noise as signal into a geographic display because of a bias toward the most-accessible data layers displayed on a base map (such as auto-generated vehicle locations) rather than the most important data. Some officers, therefore, find digital systems to be less effective than analog alternatives for conveying clear spatial information among higher- and lower-echelon commanders.76
Dealing with Ambiguity: Dangers of Dependence and Excessive Trust
Despite the trend in spatial de-skilling, technology has deepened our addiction to certain types of geographic information and changed the way we consume it — with a less critical eye and without context. But what would happen if that technology was suddenly unavailable? Unexpectedly being denied the availability, quality, and accuracy of geographic information that technology currently provides will impair decision-making at the strategic, operational, and tactical levels. There is a need for greater research on what happens when strategic decision-makers, conditioned to highly accurate and unambiguous spatial information, are suddenly denied that information or presented a deliberately deceptive spatial image.
The increasing sophistication and broader proliferation of technology that is shaping strategic situational awareness present new challenges to decision-makers. Rebecca Hersman and Bernadette Stadler argue that many of the core concepts of crisis management were developed during the Cold War; however, decision-makers have not kept pace with changes in technology since 1990.77 Furthermore, they argue the “emerging strategic situational awareness environment” will require policymakers to develop a more sophisticated understanding of the technology through which they visualize and maintain awareness of complex security challenges. Natural fog and friction are reason enough to build cognitive tools for dealing with ambiguous geographic information. However, an adversary presenting deliberately deceptive geographical information creates crucial challenges for decision-makers. Sharp power and information warfare are on the rise, and the United States has proven itself ill-prepared to deal with the deception and disinformation campaigns at which an adversary like Russia excels. Although geographic information has not yet been tampered with in the same way as other forms of communication, cartography will not be spared from the phenomenon of “deepfakes” and will inevitably be involved in what a recent RAND study called “truth decay.”78
Following the Gulf War, discussions about navigation warfare began to shift toward the operational impacts of protecting and attacking a combatant’s positioning, navigation, and timing systems on weapons guidance, command and control, and a variety of other operational functions.79 But little attention has been paid to the possibility of a systemic attack that, beyond crippling GPS and communications networks, fundamentally degrades or denies the ability of the senior leadership to make geographically informed decisions. The 2002 Millennium Challenge exercise highlighted just how poorly U.S. military commanders fare at processing a highly dynamic common operating picture, particularly when a deceptive foe pollutes that picture with false information.80 It is increasingly easy to envision a conflict in which the national command authority will have to issue new strategic guidance with no confidence in its knowledge of enemy and friendly positions and might have to act counter to a geographic picture it suspects of being deceptive.
The geographic information that supports and empowers national security decisions can be both part of the problem and part of the solution in future challenges. Cartography has always been an art that manages the ambiguity of the geographic environment and, when used carefully and effectively, can serve as an essential heuristic to aid strategic decisions even in an uncertain environment. However, to improve performance in these decisions, senior leaders in the U.S. national security community would benefit from moving away from what Gary Klein calls an “impoverished mental model” to a “rich mental model” in their consumption and use of geographic information.81
Practical Challenges of Incorporating Geography into National Security Institutions
Some of the challenges to thinking in space are rather practical. As discussed above, cartography skills are in surprisingly short supply within the Department of Defense. A broad survey of the distribution of Defense Department cartographic resources would help leadership study the possibility of equipping policy offices and planning staffs with some of the capabilities currently found only in the intelligence community. Cartographic consultants could embed within planning teams, not to give them reference material, but to help add quality geographic content to documents and presentations. However, even if staff officers and decision-makers were able to create and edit better maps, they would still face practical challenges in sharing and displaying them. Cartographers have always published maps in a wide variety of shapes and sizes, but the contemporary national security community is narrowly limited to the letter-size sheets that are easily reproduced and included in briefing books. Amateur and professional cartographers alike must struggle with the tradeoff of creating the most compelling and accurate product possible while recognizing that the limitations of printers and formatting may require a black-and-white image in “portrait” orientation.
The U.S. military’s devotion to “slideware” predates the arrival of Microsoft PowerPoint, but the dangers of the current PowerPoint addiction, which is antithetical to critical thinking, are well established in formal and informal critiques, such as the “Creed of the PowerPoint Ranger.”82 PowerPoint has some advantages when it comes to displaying maps and other geospatial information, providing a common format and platform for easy sharing of files by email. PowerPoint allows the easy import and annotation of base maps, empowering any user to attempt thematic cartography by layering crude symbols, but it is very much a double-edged sword. The ease of manipulating images and adding new symbols can obscure or misuse the underlying geographic data. PowerPoint itself, and the broader system of storing, transmitting, and displaying its files, presents important limitations similar to those of printer paper and briefing books. PowerPoint locks in a specific aspect ratio that is perfect for a map of North Dakota, but not for countries like Vietnam or Chile, which have a major north-south extent (unless, of course, one follows Harrison’s advice to abandon the arbitrary “north up” convention). Because file sizes grow quickly with high-resolution images — such as a quality map — the imperative quickly becomes reducing the resolution of embedded images, which in effect deliberately reduces the quality of a map. To support necessarily large files of quality geographic products, information technology departments should seek better integration with and adoption of alternatives to email for simple and secure transfer.
“However, even if staff officers and decision-makers were able to create and edit better maps, they would still face practical challenges in sharing and displaying them. ”
Digital displays have advantages in that they cheaply and easily display an array of dynamic content and can even support animation. A very early glimmer of how such technology might prove useful to support national security goals appeared in the use of animated terrain models through a program called PowerScene during the 1995 negotiations for the Dayton Accord.83 U.S. officials, led by Richard Holbrooke, reportedly used PowerScene to great effect with Serbian President Slobodan Milošević to demonstrate the advantages and infeasibility of different proposed border demarcations.84
Visualization of detailed three-dimensional models is widely employed by the U.S. military for mission planning, but the promise of systems like PowerScene to support national-level decision-making or multilateral diplomacy, as seen at Dayton, has not materialized. The technology demonstrated at Dayton is now widely available for free: The desktop edition of Google Earth supports fly-through control with a joystick or gamepad. If deployed more widely and if users develop a natural facility with the interface, future government officials might use such a tool for studying a problem or presenting policy options, although the low level of geographic literacy and unsophisticated employment of cartographic tools detailed above suggest that simpler and more straightforward solutions would pay greater dividends in the near term. Furthermore, those employing and using this kind of visualization tool should do so conscious of the dangers of spatial de-skilling.85
The quality of digital screens has improved dramatically in recent years, accompanied by falling prices in high-resolution displays. Nevertheless, screens still struggle to compete with paper when it comes to resolution, a major factor when rendering the fine details that the human eye can pick out of a good map. Large-format paper maps also have their own downsides. Paper maps are static, paper is expensive (and heavy in large quantity), and printers are notoriously fickle. But paper maps transport easily, roll out on any table, and work even when computers, networks, and projectors do not cooperate. The Department of Defense and national security organizations might consider shifting some of their resources away from large digital displays to make large-format color printers and plotters more widely available.
Growing a National Security Workforce Equipped to Think in Space
Although national security professionals undoubtedly score higher in geographic literacy than the general population, proper surveys of these issues would surely reveal gaps and areas for improvement. Jakub Grygiel has argued that “the education profession is failing” the needs of national security.86 Better foundational education on geography would help enrich the geographic mental models of policymakers. Students receiving a master’s degree in national security or international relations — civilian or military — ought to receive both education and training for using geography. The differences between education and training are subtle but tremendously important: If training is learning how to perform a specific task and education is learning how to think, then both are required for thinking in space.
National security professionals, whether on a military staff or at the National Security Council, could be more effective if equipped with the practical skills to develop original geographic content. They should be able to make their own maps and their own geographic arguments and know what went into them. These practical skills, though mechanical in many ways, are potentially as valuable as the mechanical skill of proper citation in academic writing that receives such heavy emphasis at the war colleges. Just as the war colleges stress critical thinking skills to turn successful operational-level leaders into effective participants in the interagency policymaking process at the strategic level, these institutions would be ideal places to build upon the practical navigational skills of pilots, sailors, and battalion commanders in order to help them create more sophisticated and strategic mental maps.87 Civilian and military graduate programs rightly require students to master clear and effective writing. These future decision-makers would similarly benefit from receiving training in the modern tools available for analyzing and presenting geographic information.
Studies at the graduate level should involve more than just remedial familiarity with maps and should emphasize skills for mastering spatial critical thinking. Over the longer term, curriculum changes could create a broader reservoir of geographic expertise at senior levels. Professional military education requirements already highlight critical thinking and briefly mention geographic factors, but the Joint Staff ought to amplify the importance of spatial thinking and communication, alongside reading and writing, in the senior schools.88 Civilian and military schools should draw on a well-established academic curriculum for all levels of cartography and visualization with commercial and open-source software suites, including free online courses. Other near-term solutions include the addition of courses on geographic skills in elective programs, or the creation of a geography adviser to aid students in incorporating geography and cartography into their work. Such an adviser, or a “geography center,” would not be the equivalent of a mapmaker on call. Rather, these advisers would serve as mentors to help students conceive geographic arguments and provide resources for gaining practical skills with tools like geographic information systems software.
ArcGIS, produced by Esri, is the overwhelmingly dominant geographic information systems software suite, with a market share akin to that of PowerPoint. The U.S. government is Esri’s largest customer and ArcGIS licenses are widely available throughout different parts of the national security community. Where licensing costs are prohibitive, the leading open-source alternative to ArcGIS is QGIS, which can serve most of the geospatial analysis and cartography needs of a typical military officer or foreign policy generalist. The sophistication of software like ArcGIS and QGIS can present steep learning curves to novices. Moreover, these software suites have capabilities that go far beyond the needs of those seeking to merely incorporate effective cartography into their communication. There are, however, several other free and user-friendly options available for quickly generating base maps tailored to the purpose required. Esri offers an online “My Map” portal that provides basic geographic information systems services and a library of base maps in different styles, with more powerful services available with a subscription.89 The “Natural Earth” project, sponsored by a consortium including the North American Cartographic Information Society, provides an extensive set of well-curated public domain data for use in mapmaking.90 The cartographer Cynthia Brewer, who has published several practical guides to effective cartographic design, also maintains a website for effective and reliably reproduced color schemes that can quite literally help the amateur cartographer or designer to “paint by numbers.”91 With a small investment in expert instruction or self-guided study, a skilled computer user can learn to create custom maps at no cost, choosing among appropriate projections in QGIS and layering data from Natural Earth.92
Conclusion
Geographic analogies are powerful instruments, though they run the same risks of cognitive bias and shallow analysis as other simplifications, such as historical analogy. The shortcomings of historical analogy have been well studied by scholars who warn against the “tyranny of the past upon the imagination,” and the dangers awaiting those who “do not examine a variety of analogies before selecting the one that they believe sheds light on their situation.”93 The great military historian Michael Howard highlighted the dangers of overlapping analogies in both history and cartography, writing that historical battlefield maps, with “neat little blocks and arrows moving in a rational and orderly way…are an almost blasphemous travesty of the chaotic truth.”94
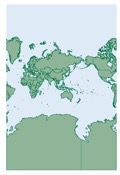
Just as one ought not to depend on a single historical analogy, a senior official or policy analyst could constrain their thinking if relying on a single geographic perspective. Geography can be just as subjective as history, and those who desire to think more effectively in space should seek out multiple perspectives in the maps they study and their own mental maps. As mentioned above, Richard Edes Harrison argued that a critical first step is to dispense with persistent conventions that inhibit a “flexible view of geography,” such as always placing north at the top of the map. Harrison also wrote, in a wartime article co-authored by Robert Strausz-Hupé, that “the main pitfall to avoid is the continual use of one map, for the mind is inexorably conditioned to its shapes. It begins to look ‘right’ and all others ‘wrong.’”95 Take as an example a map of the Taiwan Strait rotated 55 degrees. Such a map will look “wrong” at first, but has the benefit of forcing the viewer to give fresh consideration to the key distances and geographic relationships.
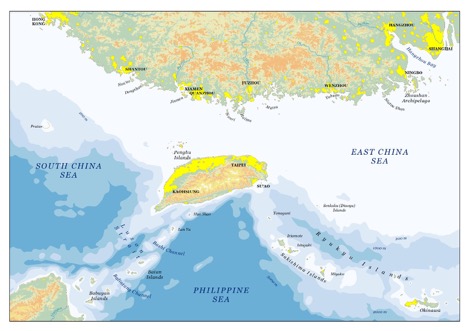 Image 4: Taiwan Strait: Richard Edes Harrison encouraged the use of maps that force a new perspective on a familiar geographic issue. Map by author, 2019.
Despite the pace of technological development and geopolitical shifts in the last two decades, the fundamental processes of national security institutions have changed remarkably little and are not conducive to the flexible view advocated by Harrison and Strausz-Hupé above.96 The bureaucratic circulatory system continues to rely on strategy documents, memos, email, briefings, and PowerPoint slides with anemic geographic content. The current distribution of cartographic capability and the standard forms of communication within the government are stagnant and may actively contribute to spatial de-skilling.97 Thus, the national security community needs to sharpen its understanding of the problem and consider different processes. There is limited data on questions of geographic literacy, trends in the use of geographic data, or the effectiveness of spatial thinking within the U.S. national security establishment. More research is needed to understand the institutional dimensions of how the U.S. government thinks in space, where the strengths and weaknesses are, what credible options for improvement exist, and what barriers inhibit their employment. Collection of such data would enable meaningful evaluation of how effectively the U.S. government’s geospatial tools and products support decision-makers and would undoubtedly suggest ways to improve the government’s use of geography and fix technical gaps and problems. Broad surveys of America’s national security institutions could not only identify any persistent holes in basic geographic knowledge but could also highlight conceptual strengths and weaknesses in employing the art and science of cartography. The findings of such investigations would provide valuable information to the civilian and military academic institutions of higher learning that shape future policymakers.
There is much work to be done in studying and improving the way the U.S. national security apparatus uses geography. However, another vital question for future scholars and analysts will be how America’s potential adversaries think in space. Succeeding in a long-term strategic competition requires a deep understanding of the thought processes, priorities, and blind spots of the other side. It is crucial to understand the persistent distortions that exist in an adversary’s worldview, what inefficiencies endure in the ways they process new and ambiguous geographic information, and what cartographic messages resonate best with their national security system.98 But this will not be possible until the U.S. national security community improves its own ability to think in space.
Thinking in space is only one tool available to decision-makers and is no panacea to crafting successful strategies and avoiding tragic blunders. But more sophisticated geographic thinking and communication will sharpen national security decision-making and help decision-makers to better communicate their plans to the public. The national security community must be a learning and adaptive organization. It needs an objective evaluation of how effectively it is employing geographic information and it must seek every opportunity to sharpen its skills in order to think effectively in space.
Andrew Rhodes is a career civil servant who has served as an expert in Asia-Pacific affairs in a variety of analytic, advisory, and staff positions across the Department of Defense and the interagency. He earned a BA in political science from Davidson College, an MA in international relations from The Johns Hopkins University School of Advanced International Studies, and a certificate in Geographic Information Sciences from the University of North Dakota. He recently graduated with highest distinction from the U.S. Naval War College and is an affiliated scholar of the Naval War College China Maritime Studies Institute.
The contents of this paper reflect the author’s own personal views and are not necessarily endorsed by the Naval War College, the Department of the Navy, or the U.S. government.
Acknowledgements: I would like to thank Peter Dutton, Michael O’Hara, Megan Rhodes, and many other Naval War College classmates, faculty, and staff who provided valuable insights for this article.